
Evaluation
Mean Square Error(MSE):
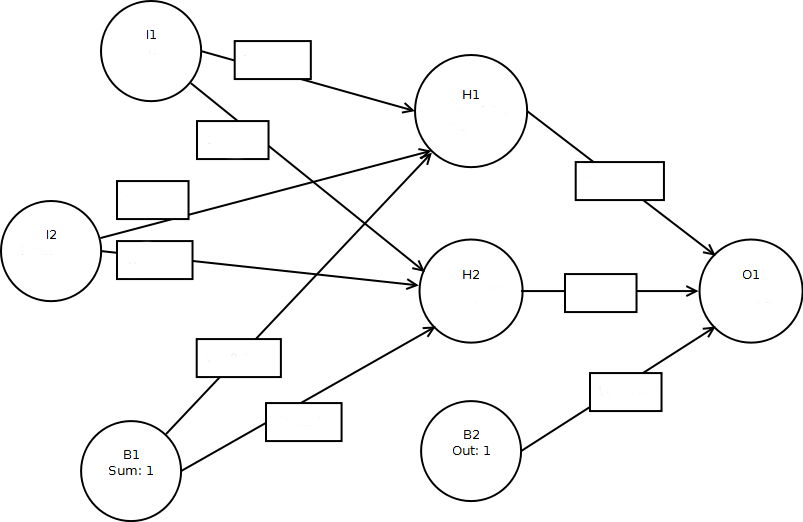
As you click the "Anneal" button, the above network is trained for the XOR function. This means that if both inputs are the same (i.e. [0,0] or [1,1]) the output should be near 0, otherwise near 1.0. The MSE value calculates How accurate the network is emulating the XOR function. The lower the MSE, the better.
The ROC curve is also a measure how how well the network is performing. The ideal is to maximize the area UNDER the ROC curve. To do this you must push one point on the ROC curve to the upper-left corner of the chart area. The chart measures true positive(TP, the number of times the network correctly output's 1) vs false positive(FP, the number of times the network incorrectly output's 1). The chart lets you balance between false positive and false negative by showing you how high TP will be for the accepted level of FP. Balancing between those two is a matter of selecting the cutoff value for the output neuron to be considered True. For example, if this cutoff were 0.75, then any output above 0.75 is true, below is false.
Calculations
The sigmoid function is calculated with the following formula: $$S(t) = \frac{1}{1 + e^{-t}}.$$ Mean Square Error(MSE) is calculated with the following formula: $$ \operatorname{MSE}=\frac{\sum_{t=1}^n (\hat y_t - y)^2}{n}. $$